• Skip to main content
  • Skip to primary sidebar

Texas A&M Center for Applied Technology

Innovation. Delivered.

Texas A&M University College of Engineering
  • Home
  • About TCAT
  • Research
  • People
  • Contact Us

Research

Data Visualization

ELITE

Electronic Laboratory Information Tracking Environment

Screenshot of the Electronic Laboratory Information Tracking Environment (ELITE) application overlayed by a colored heatmap displaying quantity of disease incidents by region.
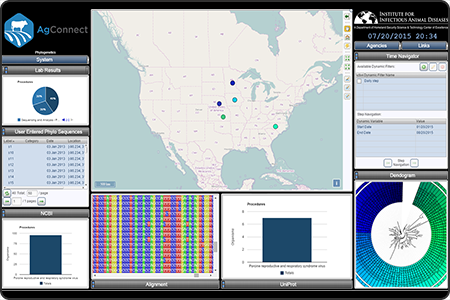
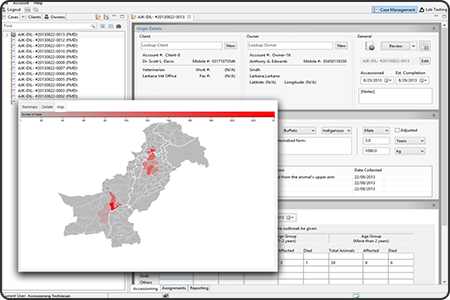
A technology that pairs a Laboratory Information Management System (LIMS) supporting daily laboratory operations with a biosurveillance module for monitoring, reporting and analyzing tracked test results for program diseases such as foot-and-mouth disease (FMD). The system can be configured to support numerous custom test types, test procedures, laboratory workflows, forms and reports, and hardware/network infrastructure, and can be defined locally or distributed throughout a network of laboratories.
Sponsor: U.S. Department of Agriculture – Foreign Agriculture Services
  • Competencies: Data Fusion, Data Visualization, Decision Support
  • Industries: Agriculture, Federal Agencies

EMBM

Electromagnetic Battle Management

Screenshot of the Electromagnetic Battle Management (EMBM) proof-fo-concept dashboard displaying a 2D aerial map in the center overlayed with filled boundaries and icons. The map is surrounded by numerous by numerous dashboard components providing various modeling data and information.
A proof-of-concept dashboard with customizable user-defined profiles, interchangeable components and enhanced visualization and analytical capabilities designed to assist Joint-level electromagnetic battle managers in the preparation, planning, execution, and analysis of warfighter operations.
Sponsor: U.S. Department of Defense
  • Competencies: Data Fusion, Data Visualization, Decision Support
  • Industries: Federal Agencies

EPS

Enhanced Passive Surveillance Analyst Workstation

Screenshot of the AgConnect Enhanced Passive Surveillance (EPS) web application that consists of a 2D map of the south-western U.S. and various counties colored within Arizona and New Mexico. The map is surrounded by numerous dashboard components providing various modeling data and information. Overlayed on the image is an iPad showing a screenshot of the mobile app with Texas counties color-coded and a graph of data.
A system for integrating and analyzing syndromic surveillance data captured from mobile apps and other relevant sources. The data is aggregated and combined with embedded visualization and analysis tools to help determine baseline conditions in order to detect any anomalies that may signal the onset of an animal disease outbreak. This is one perspective of the AgConnect system.
Sponsor: U.S. Department of Homeland Security – Science and Technology Directorate
  • Competencies: Data Fusion, Data Visualization, Modeling & Simulation, Decision Support
  • Industries: Emergency Response, Federal Agencies, Local & State of Texas

ERSS

Emergency Response Support System

Screenshot of the Emergency Response Support System (ERSS) web application that consists of a 2D U.S. topographic map in the center surrounded by numerous dashboard components providing various modeling data and information.
A web-based information dashboard developed for the USDA that can be used for incident management, as well as day-to-day planning and disease monitoring and surveillance. This tool has been used by APHIS for tracking a real-world foot-and-mouth disease outbreak in South Korea, by State Animal Health Officials to understand and manage animal health related events within their state, and by producers to monitor and assess disease status across their production systems. This is one perspective of the AgConnect system.
Sponsor: U.S. Department of Agriculture – Animal and Plant Health Inspection Service
  • Competencies: Data Fusion, Data Visualization, Decision Support
  • Industries: Agriculture, Federal Agencies

Event-based Image Sensing

Solid rendering of an Event-based Image Sensing camera system alongside a semi-transparent rendering of the electronics module.
Supported edge and corner detection and analysis algorithms and visual modeling and rendering for a real-time 3D trajectory tracking and guidance system utilizing novel event-based image sensing for vehicle docking.
Sponsor: Private Industry Partner
  • Competencies: Modeling & Simulation, Data Fusion, Data Visualization, Data Analytics
  • Industries: Federal Agencies, National Security, Training

INFORMS

International Framework for Outbreak Response Modeling and Simulation

Screenshot of the International Framework for Outbreak Response Modeling and Simulation (INFORMS) web application displaying scenarios across the top and scenario result graphs along the bottom.
A simulation-based environment for modeling the spread of a disease within livestock or poultry, effectiveness of potential disease response and control strategies, and the associated monetary costs. The system enables parameterization, management, distributed execution and aggregation of results, supporting “what-if” analysis and comparison of strategies by epidemiologists and responders in order to understand and assess potential disease events and their associated impacts.
Sponsor: U.S. Department of Agriculture
  • Competencies: Modeling & Simulation, Data Visualization
  • Industries: Emergency Response, Federal Agencies

LCEM

NAHLN Laboratory Capacity Estimation Model

Screenshot of the Laboratory Capacity Estimation Model (LCEM) web application that consists of numerous graph components and a results summary component.
A model of the National Animal Health Laboratory Network (NAHLN) diagnostic testing capacity for use by individual labs and network administration. This model allows for the identification of rate limiting processes and helps to maximize the overall efficiency of the processes used by the labs and network personnel. This is one perspective of the AgConnect system.
Sponsor: U.S. Department of Homeland Security – Science and Technology Directorate
  • Competencies: Data Fusion, Data Visualization, Data Analytics
  • Industries: Agriculture, Emergency Response, Federal Agencies, National Security

MICE

Multi-Laboratory International Collaboration Environment

Screenshot of the Multi-Laboratory International Collaboration Environment (MICE) system in which 12 separate animal research and diagnostic sites are collaborating in animal necropsies, microscope slide analyses, and PCR results interpretation.
Evaluated, selected, installed, integrated and sustained a video conferencing system infrastructure within five state, university, and federal research, diagnostic, and biocontainment veterinary laboratories across the U.S., enabling live sharing of microscope imagery, animal necropsies, laboratory test results, instrumentation, and field clinical signs between researchers and technicians across geographic and biocontainment barriers.
Sponsor: U.S. Department of Homeland Security – Science and Technology Directorate
  • Competencies: Data Visualization, Decision Support
  • Industries: Medical, Emergency Response, Training, Federal Agencies, Local & State of Texas

NDFP

National Dairy FARM Program

Photo of a cow overlayed with an iPad displaying the National Dairy FARM Program (NDFP) data collection, analysis, and reporting system.
A data collection, analysis, and reporting system to support industry-wide animal care and environmental stewardship assessments. It provides a cross platform mobile app for on-farm data collection, a data management system for configuring the system, and a reporting and analysis system all developed around a centralized database. In use by over 1,000 evaluators to conduct assessments across 160+ dairy cooperatives and processors spanning over 40,000 facilities across all 48 continental US states representing 98% of the U.S. milk supply.
Sponsor: National Milk Producers Federation
  • Competencies: Data Visualization, Data Analytics, Mobile Data Collection
  • Industries: Agriculture, Non-Profits, Private Industry

Phylogenetic Analysis Analyst Workstation

Screenshot of the AgConnect phylogenetics dashboard consisting of a 2D map overlayed with various icon markers. The map is surrounded by numerous dashboard components, including a circular dendogram displaying gene diversity.
A system to investigate strain movement and divergence across both time and space, as well as track and compare disease history and spread across animal production systems. The system integrates sequence data from multiple sources, incorporates different sequence alignment, comparison, and tree construction tools, and provides various visualization and analysis tools for working with the data. This is one perspective of the AgConnect system.
Sponsor: U.S. Department of Homeland Security – Science and Technology Directorate
  • Competencies: Data Fusion, Data Visualization, Modeling & Simulation, Decision Support
  • Industries: Agriculture, Federal Agencies

  • « Go to Previous Page
  • Go to page 1
  • 2
  • Go to page 3
  • Go to Next Page »

Navigation

  • About TCAT
    • Brief History
    • Our Model & Approach
  • Research
    • Competencies
    • Industries
  • People
  • Contact Us

Competencies

Configuration Management
Data Analytics
Data Fusion
Data Visualization
Decision Support
Digital Transformation
Digital Twins
Facility Management
Geospatial Computing
Interactive Media
Medical Technology
Mobile Data Collection
Modeling & Simulation

Industries

Agriculture
Data Analytics
Decision Support
Emergency Response
Facility Management
Federal Agencies
Local & State of Texas
Medical
National Security
Non-Profits
Private Industry
Texas A&M University System
Training

© 2016–2025 Texas A&M Center for Applied Technology Log in

Texas A&M Engineering Experiment Station Logo
  • College of Engineering
  • Facebook
  • Twitter
  • State of Texas
  • Open Records
  • Risk, Fraud & Misconduct Hotline
  • Statewide Search
  • Site Links & Policies
  • Accommodations
  • Environmental Health, Safety & Security
  • Employment