• Skip to main content
  • Skip to primary sidebar

Texas A&M Center for Applied Technology

Innovation. Delivered.

Texas A&M University College of Engineering
  • Home
  • About TCAT
  • Research
  • People
  • Contact Us

Research

Data Visualization

3DTV

3D Terrain Visualization

This image contains a screenshot of the 3D Terrain Visualization (3DTV) application in which there is a first-person view of rolling hills textured with military raster imagery, clickable icons of units in the field, a overhead scrolling map inset marking the user's position and orientation, and a text area indicating the user's latitude and longitude. Also pictured is the hardened and ruggedized military system running the 3DTV application.
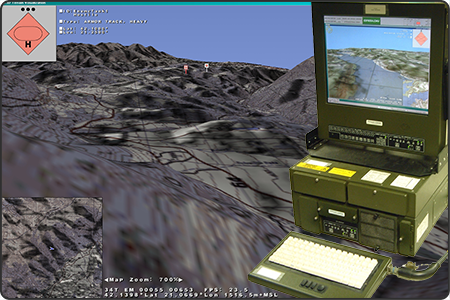
Developed a 3D terrain visualization capability integrated by Lockheed Martin into the digital Army Battle Command System (ABCS) that provides accurate line of sight and real-time unit locations on an optimally adapting mesh terrain overlayed with military terrain imagery and unit symbology.
Sponsor: U.S. Army Central Technical Support Facility
  • Competencies: Modeling & Simulation, Data Visualization, Decision Support
  • Industries: National Security, Federal Agencies

ALIM

Asset Lifecyle Information Management System

Screenshot of the Asset Lifecycle Information Management System (ALIM) web application user interface containing a hierarchy of functional locations on the left, a 3D rendering of a research bay with a selected X-Ray system in the center, and various properties of the X-Ray system on the right.
An integrative, data-driven framework to enhance situational awareness and decision support for day-to-day facility management, helping increase facility and equipment availability for production work through the strategic integration of data and technology.
Sponsor: U.S. Department of Energy
  • Competencies: Digital Twins, Data Visualization, Digital Transformation, Configuration Management, Facility Management, Decision Support
  • Industries: Federal Agencies

BCOP

Biosurveillance Common Operating Picture

Screenshot of the Biosurveillance Common Operational Picture (BCOP) web application that consists of a 3D view of the U.S. Capitol in the center and surrounded by numerous dashboard components providing various modeling data and information.
A web-based information dashboard that provides analysts from the National Biosurveillance Integration Center the ability to track and monitor disease outbreaks across the world. This tool provides a common integrated view of the information for both situational awareness and decision-making, and is has been deployed for use in a 24/7 Department of Homeland Security command center.
Sponsor: U.S. Department of Homeland Security – Science and Technology Directorate
  • Competencies: Data Fusion, Data Visualization, Data Analytics
  • Industries: Agriculture, Emergency Response, Federal Agencies, National Security

BFES

Biosurveillance Field Entry System

Image containing a photo of a person in a cattle pasture clicking an iPad tablet to fill out an animal assessment. Also shown is the BFES application login screen.
A cross platform mobile application that can be used by veterinarians for easily capturing of syndromic symptoms of animals in the field. This application allows for form-based submission in both a live and store-and-forward fashion for use in even very rural locations. The results can be queried and displayed in both a geospatial and temporal fashion within an analyst workstation. This is one perspective of the AgConnect system.
Sponsor: U.S. Department of Homeland Security – Science and Technology Directorate
  • Competencies: Data Fusion, Data Visualization, Data Analytics
  • Industries: Agriculture, Emergency Response, Federal Agencies, National Security

CGDS

Coast Guard Display System

Screenshot of the Coast Guard Dashboard System that consists of a center map of the Puget Sound, Washington, area overlayed with vessel icons. The map is surrounded by numerous dashboard components providing various modeling data and information.
A web-based information dashboard that provides a user-defined common operating picture across multiple echelons and within different functional areas. This tool was used as part of an on-the-water exercise by the Coast Guard’s Sector Seattle Command Center in August of 2009. These dashboards provided integration of live data feeds describing the current operational environment, real-time video and sensors for providing monitoring and surveillance capabilities, and custom simulation and visual analytic products. The common integration of these diverse tools supported the full decision-making process.
Sponsor: U.S. Department of Homeland Security – Science and Technology Directorate
  • Competencies: Data Fusion, Data Visualization, Data Analytics
  • Industries: Agriculture, Emergency Response, Federal Agencies, National Security

Crosswalk

This is a project placeholder image of the TCAT challenge coin that consists of a picture of the state of Texas in red, white, and blue overlayed with the words "TCAT - Innovation. Delivered." The challenge coin is on top of a TCAT poster image from it's 20th anniversary back in 2014.
A database conversion tool for Air Force base realignment and closure actions. Enables easy tracking and visualization of environmental cleanup operations across multiple Air Force bases.
Sponsor: U.S. Air Force Center for Engineering and the Environment
  • Competencies: Data Visualization
  • Industries: Federal Agencies

DEx

Database of Dramatic Extracts

Screenshot of the Dramatic Extracts (DEx) web-based tool that makes manuscript texts searchable.
A web-based tool that aims to make TEI-encoded manuscripts (hand-encoded seventeenth manuscripts into machine-readable formatted files) publicly browsable and searchable by textual editors, literary scholars, and cultural historians around the world. DEx is an online resource that allows users to browse and filter extracts by play, playwright, and manuscript, view the extracts’ context in both the original manuscript and the original work from which it was transcribed, and discover other manuscripts from the same repository.
Sponsor: John Templeton Foundation
  • Competencies: Data Visualization, Data Analytics
  • Industries: Non-Profits

DFA Gold Standard / Protect Our Brand

Dairy Farmers of America

Photo of a dairy cow overlayed with an iPad displaying a custom animal assessment form developed for the Dairy Farmers of America (DFA).
Deployed a cross-platform mobile data collection app and form framework for the largest dairy cooperative in the U.S. to synchronize databases, implement two data collection forms, implement action plans for continuous improvement, and other user enhancements such as auto-answering triggers, photo capture, signature capture, autofill, and GPS location capture.
Sponsor: Dairy Farmers of America
  • Competencies: Data Visualization, Data Analytics, Mobile Data Collection
  • Industries: Agriculture, Non-Profits, Private Industry

DPS

Dynamic Preparedness System

Screenshot of the Dynamic Preparedness System (DPS) prototype that consists of a 2D map overlaid with various icons, weather, and plume models in the center and surrounded by numerous dashboard components providing various modeling data and information.
Designed, developed, and deployed an information dashboard to provide relevant, integrated, and real-time information to decision-makers by presenting a user-defined common operating picture synthesizing authoritative data sources.
Sponsor: Texas A&M AgriLife Research – Institute for Infectious Animal Diseases
  • Competencies: Data Fusion, Data Visualization, Data Analytics
  • Industries: Agriculture, Emergency Response, Federal Agencies, National Security

E2E

Engage to Excel

Screenshot of the Engaged to Excel (E2E) web application that consists of a 2D U.S. map overlaid with various icons and animal movement lines as well as colored states. The map is surrounded by numerous dashboard components providing various modeling data and information.
Developed innovative technology to support secure data compartmentalization, sharing, visualization, and analysis that enables animal producers to maintain business continuity and perform risk management during an active animal disease outbreak, thereby minimizing business downtime and negative effects on the U.S. economy.
Sponsor: U.S. Department of Homeland Security – Science and Technology Directorate
  • Competencies: Data Fusion, Data Visualization, Data Analytics
  • Industries: Agriculture, Emergency Response, Federal Agencies, National Security

  • 1
  • Go to page 2
  • Go to page 3
  • Go to Next Page »

Navigation

  • About TCAT
    • Brief History
    • Our Model & Approach
  • Research
    • Competencies
    • Industries
  • People
  • Contact Us

Competencies

Configuration Management
Data Analytics
Data Fusion
Data Visualization
Decision Support
Digital Transformation
Digital Twins
Facility Management
Geospatial Computing
Interactive Media
Medical Technology
Mobile Data Collection
Modeling & Simulation

Industries

Agriculture
Data Analytics
Decision Support
Emergency Response
Facility Management
Federal Agencies
Local & State of Texas
Medical
National Security
Non-Profits
Private Industry
Texas A&M University System
Training

© 2016–2025 Texas A&M Center for Applied Technology Log in

Texas A&M Engineering Experiment Station Logo
  • College of Engineering
  • Facebook
  • Twitter
  • State of Texas
  • Open Records
  • Risk, Fraud & Misconduct Hotline
  • Statewide Search
  • Site Links & Policies
  • Accommodations
  • Environmental Health, Safety & Security
  • Employment