• Skip to main content
  • Skip to primary sidebar

Texas A&M Center for Applied Technology

Innovation. Delivered.

Texas A&M University College of Engineering
  • Home
  • About TCAT
  • Research
  • People
  • Contact Us

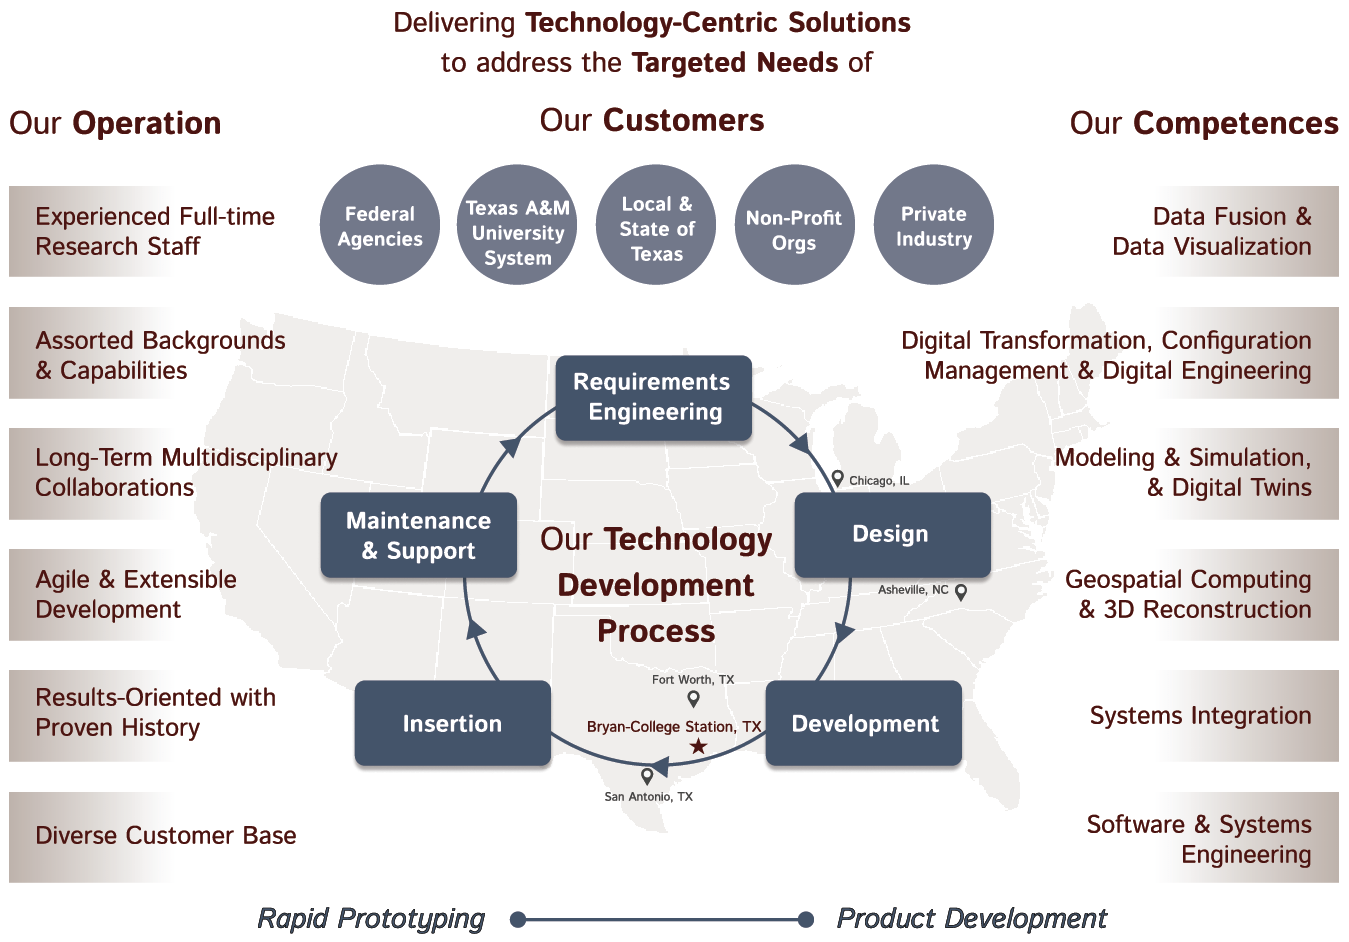
Texas A&M Center for Applied Technology

The Texas A&M Center for Applied Technology (TCAT) provides high quality, applied research and development of technology-centric solutions to address the critical needs of our customers.

  • Screenshot of the Study Data Manager (SDM) web application in which the overall study summary information and graph is displayed at the top and very detailed graphical data capture information is displayed at the bottom for the various devices worn by the various human patients participating in the study.
  • Image of two iPads displaying the login and data entry screens for the Kenya Animal Biosurveillance System (KABS) mobile application.
  • Screenshot of the International Framework for Outbreak Response Modeling and Simulation (INFORMS) web application displaying scenarios across the top and scenario result graphs along the bottom.
  • Screenshot of the RELLIS Reservation System (RRS) that tracks the current operations taking place across the RELLIS campus. The screenshot displays a aerial map of the campus with reserved 50 square meter reserved regions color-coded by ground or airspace and embedded with symbology indicating various limiting conditions.
  • This image depicts 4 aspects of the DREAMS (Disaster Relief and Emergency Medical Services) Digital EMS project: a screenshot of the software user interface, a military HMMWV ambulance, a white civilian ambulance, and a dual-screen Physician cart.
  • Screenshot of the Multi-Laboratory International Collaboration Environment (MICE) system in which 12 separate animal research and diagnostic sites are collaborating in animal necropsies, microscope slide analyses, and PCR results interpretation.
  • This image depicts several aspects of the FASTSTAR (Fletcher Allen Specialized Telemedicine for Supporting Transfer And Rescue) digital ambulance project: a rugged mobile laptop with a FASTSTAR screenshot, a rugged Grab & Go case with external connectors for various devices, and a photo of the FASTSTAR ambulance.
  • Screenshot of the Laboratory Capacity Estimation Model (LCEM) web application that consists of numerous graph components and a results summary component.
  • Photo of a cow overlayed with an iPad displaying the National Dairy FARM Program (NDFP) data collection, analysis, and reporting system.
  • Photo of a dairy cow overlayed with an iPad displaying a custom animal assessment form developed for the Dairy Farmers of America (DFA).
  • Screenshot of the Welcome page for the Configuration Management Quality Assurance (CQMA) tool, an online software configuration management tool that provided an environment for running quality assurance checks on battlefield functional area system software.
  • Screenshot of the AgConnect phylogenetics dashboard consisting of a 2D map overlayed with various icon markers. The map is surrounded by numerous dashboard components, including a circular dendogram displaying gene diversity.
  • Screenshot of the myDiabetes Score result data and graphs overlayed with a smartphone displaying the welcome page to the myDiabetes Score mobile application.
  • Screenshot of the Electromagnetic Battle Management (EMBM) proof-fo-concept dashboard displaying a 2D aerial map in the center overlayed with filled boundaries and icons. The map is surrounded by numerous by numerous dashboard components providing various modeling data and information.
  • Screenshot of the Infrastructure and Essential Services (IES) splash screen.
  • Screenshot of the Dramatic Extracts (DEx) web-based tool that makes manuscript texts searchable.
  • This image contains a screenshot of the 3D Terrain Visualization (3DTV) application in which there is a first-person view of rolling hills textured with military raster imagery, clickable icons of units in the field, a overhead scrolling map inset marking the user's position and orientation, and a text area indicating the user's latitude and longitude. Also pictured is the hardened and ruggedized military system running the 3DTV application.
  • Screenshot of the Biosurveillance Common Operational Picture (BCOP) web application that consists of a 3D view of the U.S. Capitol in the center and surrounded by numerous dashboard components providing various modeling data and information.
  • Image containing a photo of a person in a cattle pasture clicking an iPad tablet to fill out an animal assessment. Also shown is the BFES application login screen.
  • Screenshot of the Dashboard for Irrigation Efficiency Management (DIEM) web application displaying an input parameter component and numerous resulting graphs.
  • Screenshot of the Emergency Response Support System (ERSS) web application that consists of a 2D U.S. topographic map in the center surrounded by numerous dashboard components providing various modeling data and information.
  • Screenshot of the Dynamic Preparedness System (DPS) prototype that consists of a 2D map overlaid with various icons, weather, and plume models in the center and surrounded by numerous dashboard components providing various modeling data and information.
  • Solid rendering of an Event-based Image Sensing camera system alongside a semi-transparent rendering of the electronics module.
  • Screenshot of the Laboratory Animal Records Application (LARA) web application.
  • A photo inside a chicken production barn overlayed with a laptop displaying the data entry screen for the poultry depopulation decision support tool.
  • Image of two iPads displaying the Mobile application for Certificates of Veterinary Inspection (mCVI) login screen and an example Certificate of Veterinary Inspection.
  • This is a photo of the mLife mobile healthcare research vehicle at sunset.
  • This image contains a screenshot of the 3D Terrain Visualization (3DTV) application in which there is a first-person view of rolling hills textured with military raster imagery, clickable icons of units in the field, a overhead scrolling map inset marking the user's position and orientation, and a text area indicating the user's latitude and longitude. Also pictured is the hardened and ruggedized military system running the 3DTV application.
  • Coloreful rendering of a DNA sequence over a black background.
  • Screenshot of the Process-oriented Data Visualization (ProDV) application consisting of an aerial map and surrounded by other data components and graphs.
  • Screenshot of a sector aggregate analysis for the U.S. Roundtable for Sustainable Poultry & Eggs (US-RSPE) Sustainability Framework, consisting of questions and graphs of aggregate data.
  • Screenshot of the Athena Human Social Cultural Behavior (HSCB) decision simulation application in which a 2D thematic map is overlayed with colored regions and unit icons.
  • Screenshot of the Engaged to Excel (E2E) web application that consists of a 2D U.S. map overlaid with various icons and animal movement lines as well as colored states. The map is surrounded by numerous dashboard components providing various modeling data and information.
  • Photo of the inside of a warehouse overlayed with a laptop displaying the Universal Audit Tool (UAT) interface.
  • Screenshot of the Asset Lifecycle Information Management System (ALIM) web application user interface containing a hierarchy of functional locations on the left, a 3D rendering of a research bay with a selected X-Ray system in the center, and various properties of the X-Ray system on the right.
  • Image containing two screenshots Special Divine Action (SDA) application: one showing a force-directed graph of related literary works and a second showing the imagery and scanned text from a digital book.
  • Screenshot of the Electronic Laboratory Information Tracking Environment (ELITE) application overlayed by a colored heatmap displaying quantity of disease incidents by region.
  • Screenshot of the Coast Guard Dashboard System that consists of a center map of the Puget Sound, Washington, area overlayed with vessel icons. The map is surrounded by numerous dashboard components providing various modeling data and information.
  • Screenshot of the Emergency Management Exercise System (EM*ES) in which a timeclock is displayed in the upper left corner, a tabbed menu across the top, and the remainder of the screen is a 2D map overlayed with various boundary lines and a plume model.
  • Screenshot of the first-person Emergency Management Exercise System – Virtual (EM*ES Virtual) simulation-based virtual training system. The screen displays multiple fire personnel carrying a stretcher to retrieve an injured industry worker.
  • A screenshot of the interactive multimedia presentation documenting the efficiency and effectiveness of the Central Technical Support Facility (CTSF) at Fort Hood, Texas.
  • Image containing the COVID Key application logo, a smartphone displaying the COVID Key login screen, and a smartphone displaying the user's COVID clearance results.
  • Photo of the Micro Grid trailer, a deployable emergency power solution for emergency response and recovery operations along the Texas-Mexico border.
  • Screenshot of the AgConnect Enhanced Passive Surveillance (EPS) web application that consists of a 2D map of the south-western U.S. and various counties colored within Arizona and New Mexico. The map is surrounded by numerous dashboard components providing various modeling data and information. Overlayed on the image is an iPad showing a screenshot of the mobile app with Texas counties color-coded and a graph of data.
  • Screenshot of the Brazos Valley Watersmart website with a map of the county and icons indicating regions that do not need to water their lawns today.
  • Image of four screenshots: ProDV data analytics platform in the upper left, One Semi-Automated Forces (OneSAF) computer-generated forces in the upper right, First-Person Cultural Trainer (FPCT) interactive 3D environment in the lower left, and the Joint Non-kinetic Effects Model (JNEM) Human Social Cultural Behavior (HSCB) simulation in the lower right.
  • Screenshot of the Visual Interface for the Integrated Decision Support System (VIDSS) web application displaying multiple agriculture-related thematic maps and information dashboard components.
  • Screenshots of Lifeline dispatcher web application consisting of a a 2D aerial map on the right overlayed with a selected dispatch location and a list of events/personnel on the left. Overlayed on top of the screenshot is a smartphone with the Lifeline app login screen.
  • Image of three smartphones displaying login and two results screenshots from the Irrigation Decision Support System for Conserving Resources and Optimizing Production (idCROP) mobile application.
  • Screenshot of the Wildlife Disease Spread Model (WDSM) web application containing a 2D topographic map overlayed with colored boundaries. Surrounding the map are several information and data graph components.


This is a diagram about delivering Technology-Centric Solutions to address the Targeted Needs of our Operation, our Customers, our Competencies. TCAT has experienced full-time research staff with assorted backgrounds and capabilities, long-term multidisciplinary collaborations, agile and extensible development, results-oriented with proven history, and a diverse customer base. TCAT spans the continuum from rapid prototyping to product development.

Navigation

  • Texas A&M Center for Applied Technology
  • About TCAT
    • Brief History
    • Our Model & Approach
  • Research
    • Competencies
    • Industries
  • People
  • Contact Us

© 2016–2025 Texas A&M Center for Applied Technology Log in

Texas A&M Engineering Experiment Station Logo
  • College of Engineering
  • Facebook
  • Twitter
  • State of Texas
  • Open Records
  • Risk, Fraud & Misconduct Hotline
  • Statewide Search
  • Site Links & Policies
  • Accommodations
  • Environmental Health, Safety & Security
  • Employment